obesity.gif

Map showing history of obesity in U.S. / Centers for Disease Control and Prevention
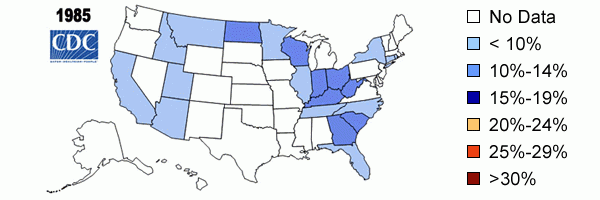
The animated map shows the increase in the percent of obese (BMI >30) U.S. adults from 1985 through 2011.

Map showing history of obesity in U.S. / Centers for Disease Control and Prevention
The animated map shows the increase in the percent of obese (BMI >30) U.S. adults from 1985 through 2011.